Weekly Meter
DC / MD / VA / WV
We compare contract activity for the same seven-day period of the previous year in Loudoun County, Prince William County, Northern Virginia, Washington, DC, and Prince George's County. These statistics are updated on a weekly basis. Sign up for our newsletter on the latest market data.

Surviving the New Ice Age
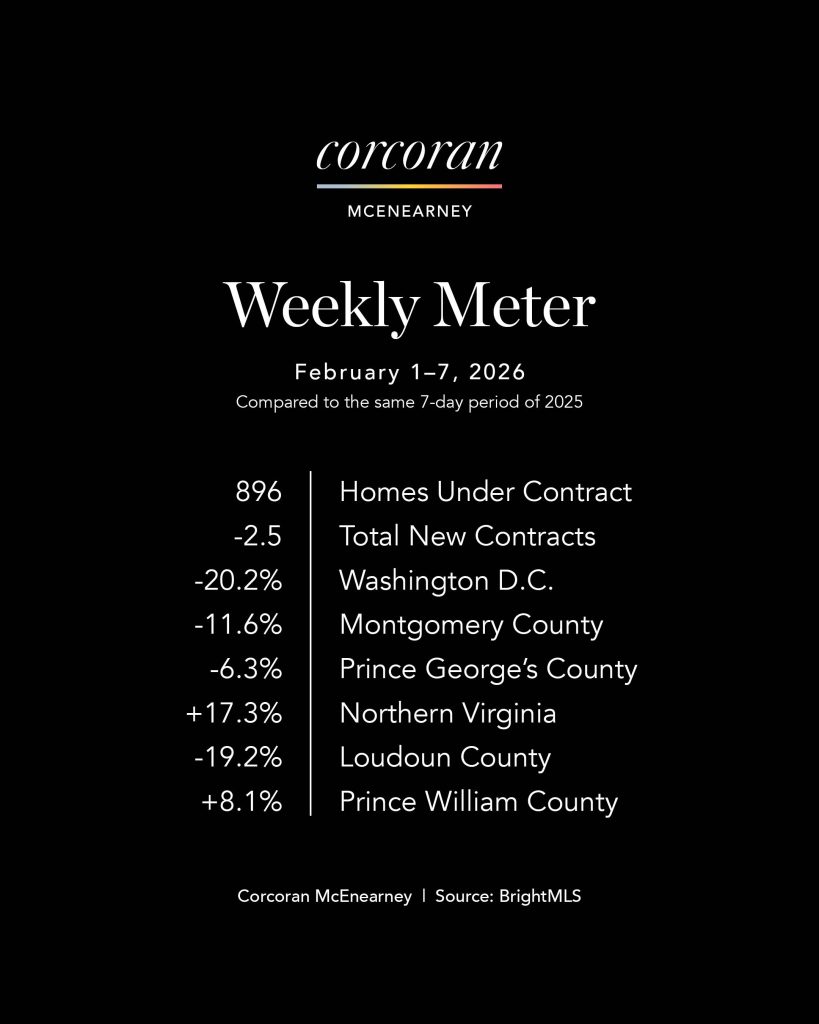
Total new contract activity fell by a modest 2.5% for the week of February 1 – 7, 2025 compared to the same week last year.
Key Takeaways
- If it feels like we’ve slipped into a short-lived Ice Age, you’re not imagining it. Last week’s brutally cold temperatures made showings more challenging, sidewalks less forgiving, and open houses a test of human endurance. And yet—remarkably—the housing market kept moving.
- Across the Metro DC area, there were 896 newly ratified contracts last week, just slightly below the 919 contracts recorded during the same week last year. Given the weather conditions, that’s a surprisingly resilient showing and a reminder that motivated buyers don’t disappear just because the thermostat bottoms out.
- That said, the cold did slow things down. Average days on market increased from 39 days this time last year to 55 days last week, reinforcing a theme we’ve seen all year: buyers are active, but they are deliberate. Add sub-freezing temperatures to an already thoughtful market, and timelines naturally stretch.
- The hearty souls in Northern Virginia once again demonstrated their relative strength, buoyed by steady activity across most price points—even as showings became harder to schedule. Montgomery County and Washington, DC saw more pronounced slowdowns, particularly at higher price ranges where discretionary buyers were more inclined to wait for better conditions. Prince George’s County activity softened modestly, while Loudoun and Prince William reflected the broader pattern of resilience tempered by weather-driven caution.
- What stands out most is not the slight year-over-year dip in contracts, but how narrow that gap is given the circumstances. This was not a market retreat—it was a market wearing a heavy coat and moving a little more carefully.
Why It Matters
- Cold weather weeks tend to distort short-term data. Fewer showings mean fewer immediate decisions, which shows up as higher days on market. But history suggests these moments often lead to a release of pent-up activity once conditions improve.
- In other words, buyers didn’t leave—they just stayed indoors.
The Ice Age Didn’t Stop the Countryside
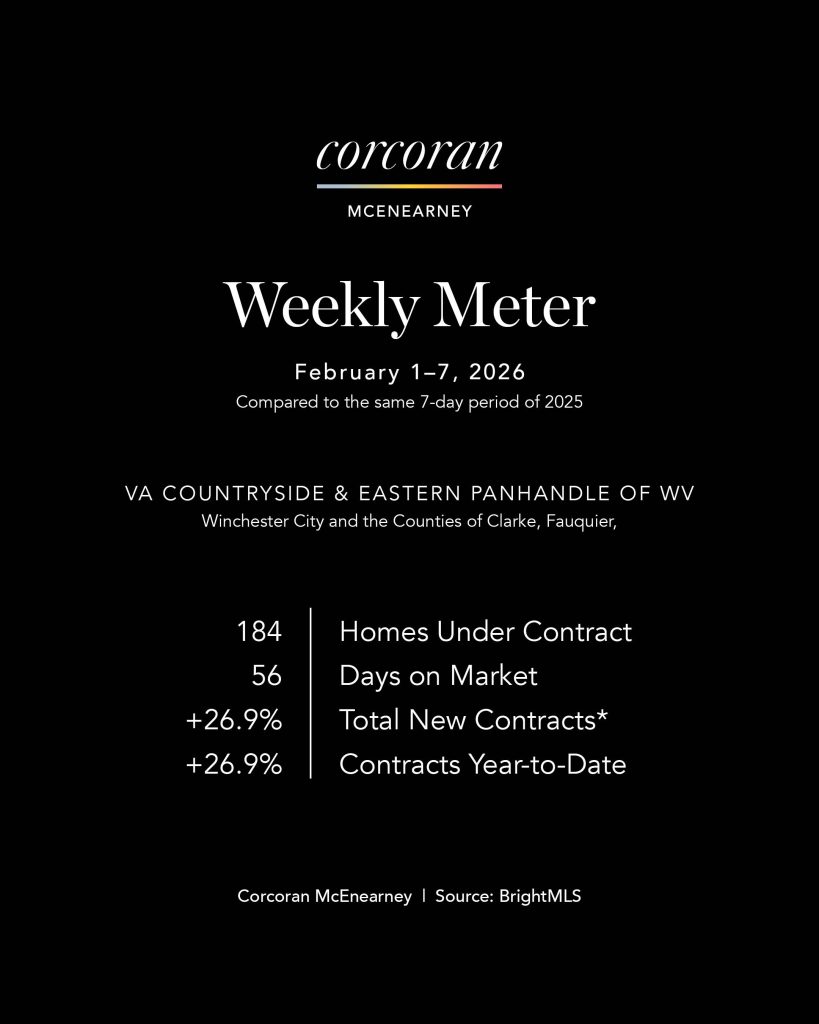
Contract activity for February 1 - 7, 2026 in the Virginia Countryside and West Virginia Panhandle rose 26.9% compared to the same seven-day period last year.
Key Takeaways
- If last week felt less like winter and more like a preview of the next Ice Age, the numbers suggest buyers in the Virginia Countryside and West Virginia Panhandle simply put on another layer and kept going.
Across the two areas combined, there were 184 newly ratified contracts last week, up from 145 during the same week last year—a notable increase given the bitter cold and the logistical challenges of showing property in rural and semi-rural markets - That kind of year-over-year gain, under the conditions, speaks to genuine demand rather than seasonal noise.
- Even more telling, average days on market increased only modestly—from 53 days last year to 57 days last week. In a week when driveways froze, roads were questionable, and open houses required bravery, timelines barely budged. Buyers remained active and decisive, particularly in the West Virginia Panhandle, where contract activity surged across core price ranges.
- The Virginia Countryside showed a more balanced pattern, with some softness under $750,000 offset by strength at higher price points. Year-to-date performance remains firmly ahead of last year, reinforcing that last week’s results were shaped more by weather logistics than by buyer hesitation.
- In short, while the Metro market slowed under extreme cold, the Countryside and Panhandle markets quietly demonstrated their durability. This wasn’t a market retreat—it was a market wearing boots.
Why It Matters
- Weeks like this help separate fragile momentum from real demand. Despite extreme cold, contract activity increased year over year and days on market barely moved. That combination points to a market that is steady, confident, and less dependent on perfect conditions to function.
The Real Estate Details
- Virginia Countryside was down 2.5% but is up 15.6% year-to-date.
- West Virginia Panhandle was up 63.1% and is up 11.3% year-to-date.


